


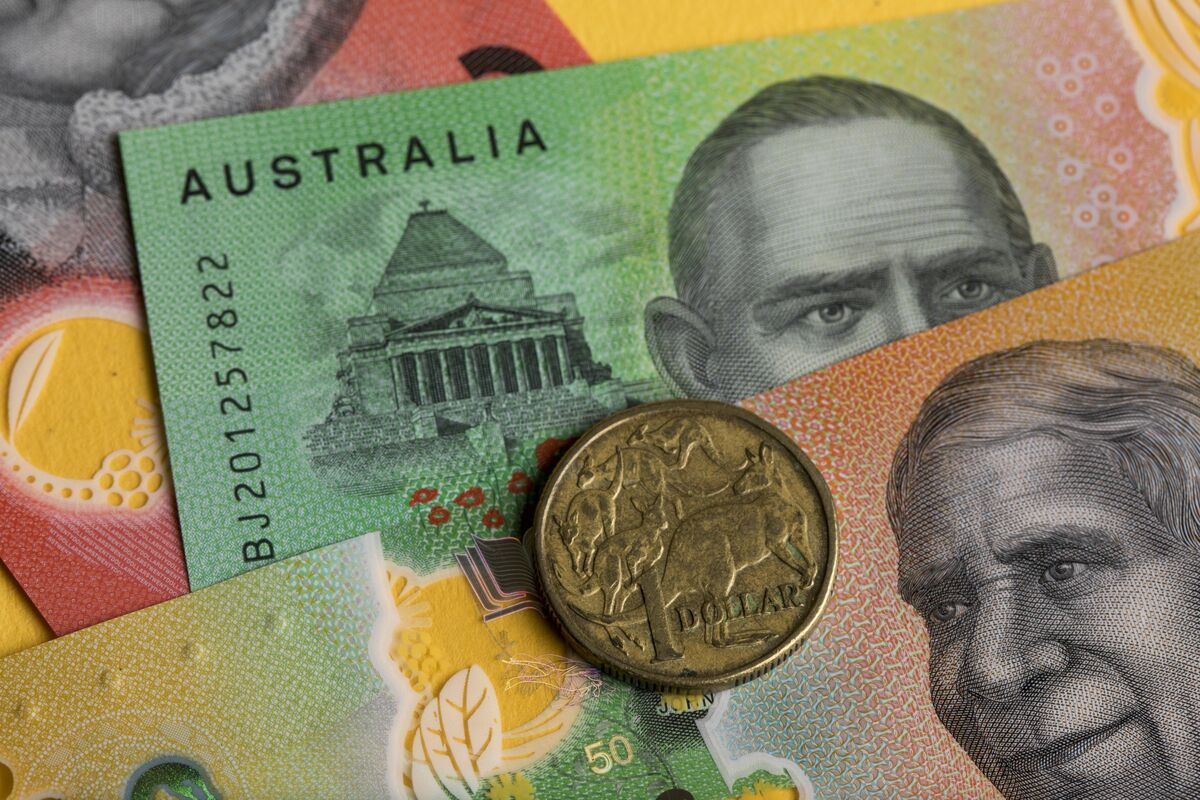
Start with the raw numbers. The Reserve Bank of Australia has lifted its cash rate to 4.35 percent – its third hike of 2026, restoring December 2024’s peak. The Bank of Japan sits at 0.75 percent, the highest level since 1995, a level held since January despite Japan’s hottest inflation environment in four years. The spread between the two policy rates is 360 basis points, up 50 basis points in six months. That gap is almost the entire analytical story for AUD/JPY, which struck multi-decade highs around 114.70 earlier in May before pulling back. YourDailyAnalysis dissects this pair as one of the cleanest expressions of central-bank divergence in the G10 space today.
The mechanics work like this. Borrow yen at 0.75 percent, buy Australian dollars yielding 4.35 percent, and collect the spread as long as AUD does not depreciate faster than carry accrues. When the trade works, it looks deceptively simple. When it turns, it unwinds fast and all at once – as happened in July 2024, when the BOJ raised rates and cut JGB purchases simultaneously, sending USD/JPY crashing toward 139 before Governor Ueda was summoned to a special parliamentary session to justify the move. The structural divergence in 2026 is wider than it was then. That matters not because a repeat is inevitable but because the crowd inside the same trade is larger now. Crowded trades look calm right up until they do not. The team at YourDailyAnalysis measures the current carry differential as the widest yield-seeking window in AUD/JPY since 2007, and the crowding risk is the part traders tend to underweight.
Two catalysts could flip the equation. The first is Australia’s labor market. Unemployment jumped to 4.5 percent in April – a four-and-a-half-year high – from 4.3 percent in March. That print alone cut the probability of another RBA hike at the next meeting from 13 percent to just 3 percent, according to Westpac market pricing. RBA Governor Michele Bullock has signaled that energy-driven inflation from the Gulf conflict could keep the hiking cycle alive, but one more weak jobs report would challenge that conviction directly. Markets currently price the Australian policy rate at 4.7 percent by end-2026 with no cuts before 2028. One bad employment print does not end the cycle, but it raises the cost of entering new long-AUD positions at current levels. Journalists track the monthly labor release as the single swing factor for RBA pricing over the next two months.
The second catalyst is Tokyo. The BOJ voted 8-1 at its March meeting to hold at 0.75 percent, with one dissenter pushing for an immediate hike to 1 percent. Governor Kazuo Ueda has signaled further tightening ahead, but the bank faces a contradiction: the yen is flirting with 160 against the dollar, intervention risk is live, and yet the Nikkei 225 hovers near 60,000 in record territory. Japan’s Q1 GDP came in at 0.5 percent quarter-on-quarter – above the 0.4 percent consensus – and annualized at 2.1 percent, the fastest pace in six quarters. Robust growth gives the BOJ more room to normalize. YourDailyAnalysis spots the hidden two-sided risk: the BOJ is the most hawkish it has been in 30 years, and yet the yen keeps losing ground against the dollar.
There is a third scenario worth considering. Gulf risk has scrambled the yen’s traditional safe-haven function. Japan imports nearly all of its energy, and sustained Hormuz disruption feeds directly into the import bill. Economy Minister Minoru Kiuchi said the government is monitoring the Middle East situation’s economic impact on households and businesses. That exposure has capped yen gains even on days when risk appetite deteriorates globally – unusual for a currency that historically strengthens during stress. The result is a pair that refuses to break clearly in either direction. Analysts at Your Daily Analysis weigh this structural ambiguity as a reason to watch intervention signals from Japan’s Ministry of Finance closely.
The base case: AUD/JPY holds a range of 109 to 117 through 2026, with 115 to 117 in play by Q3 if the RBA delivers one more hike and the BOJ delays, and 107 to 108 if Australian employment deteriorates further. The asymmetry is structural: carry accrues over weeks and unwinds in hours. The next RBA meeting, BOJ June guidance, and Australia’s monthly employment release all arrive close together. That concentration of event risk is precisely when the carry trade’s smile tends to disappear the fastest.