


The April housing data landed with a thud. Single-family housing starts fell 9.0% to a seasonally adjusted annual rate of 930,000 units, down from a 13-month high of 1.022 million in March, according to the U.S. Census Bureau and HUD release of May 21, 2026. Total starts across all categories dropped 2.8% to 1.465 million, pulling back from the upwardly revised March reading of 1.507 million – itself the highest since December 2024. The editors at YourDailyAnalysis lay out the month’s split: while multi-family construction jumped 14.3% to 529,000 units, the single-family decline absorbed all the attention, and rightly so. Single-family starts are the housing market’s core signal – they trace individual household formation, credit availability, and builder confidence far more cleanly than the multi-family segment, which is largely driven by institutional capital chasing rental yields.
Position the data against history. A 930,000 pace is not a collapse. For context, single-family starts spent most of 2023 and early 2024 running below 900,000, and the post-2008 recovery floor touched 430,000 in April 2009. The current reading sits above pre-pandemic averages in some years. But the directional move matters: March’s surge to 1.022 million was the kind of print that builders and mortgage markets interpret as a turning point. April erased most of that gain in one month. Either March was statistical noise amplified by seasonal adjustment factors (the Census margin of error is ±7.5%), or builders genuinely pulled back after reading deteriorating affordability signals. YourDailyAnalysis benchmarks the April reading against the 2025 full-year average near 940,000 – meaning this month dips just below even that subdued baseline. Neither interpretation is reassuring.
YourDailyAnalysis dissects the permit data as the more forward-looking variable. Single-family authorizations fell 2.6% in April to 872,000 units, below the revised March figure of 895,000. Building permits reflect builder decisions made weeks or months before shovels hit the ground. A permits reading of 872,000 is the lowest in several months and sits 5.4% below the April 2025 rate of 922,000. The pipeline is narrowing. There is a counter-argument worth taking seriously: April permits also saw a sharp multi-family increase to 514,000 units, suggesting developers are rotating capital toward rental product rather than for-sale homes. That rotation is rational when mortgage rates stay elevated, but it does not help the first-time buyer staring at a 7%-plus 30-year fixed rate.
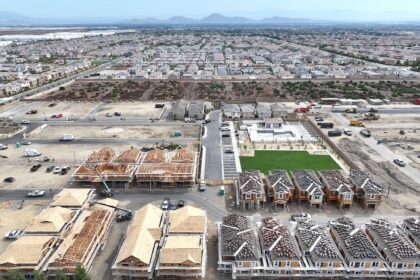
The regional breakdown produces a nuanced picture. The Northeast gained 16.1% to 180,000 units, the Midwest added 2.5% to 206,000, and the West rose 5% to 356,000. But the South fell 9.1% to 794,000. That Southern decline carries the most weight. Markets like Dallas, Phoenix, Tampa, and Charlotte absorbed the bulk of post-pandemic single-family construction; when the South softens, the national number follows. The 30-year fixed rate has remained stubbornly above 7% for much of 2026, compressing affordability across the price spectrum. The Iran war has added a fresh inflation input through energy costs, bleeding into material prices and builder margins. Analysts at YourDailyAnalysis attribute the South’s outsized decline partly to affordability compression in the very Sun Belt markets that led the post-pandemic construction wave.
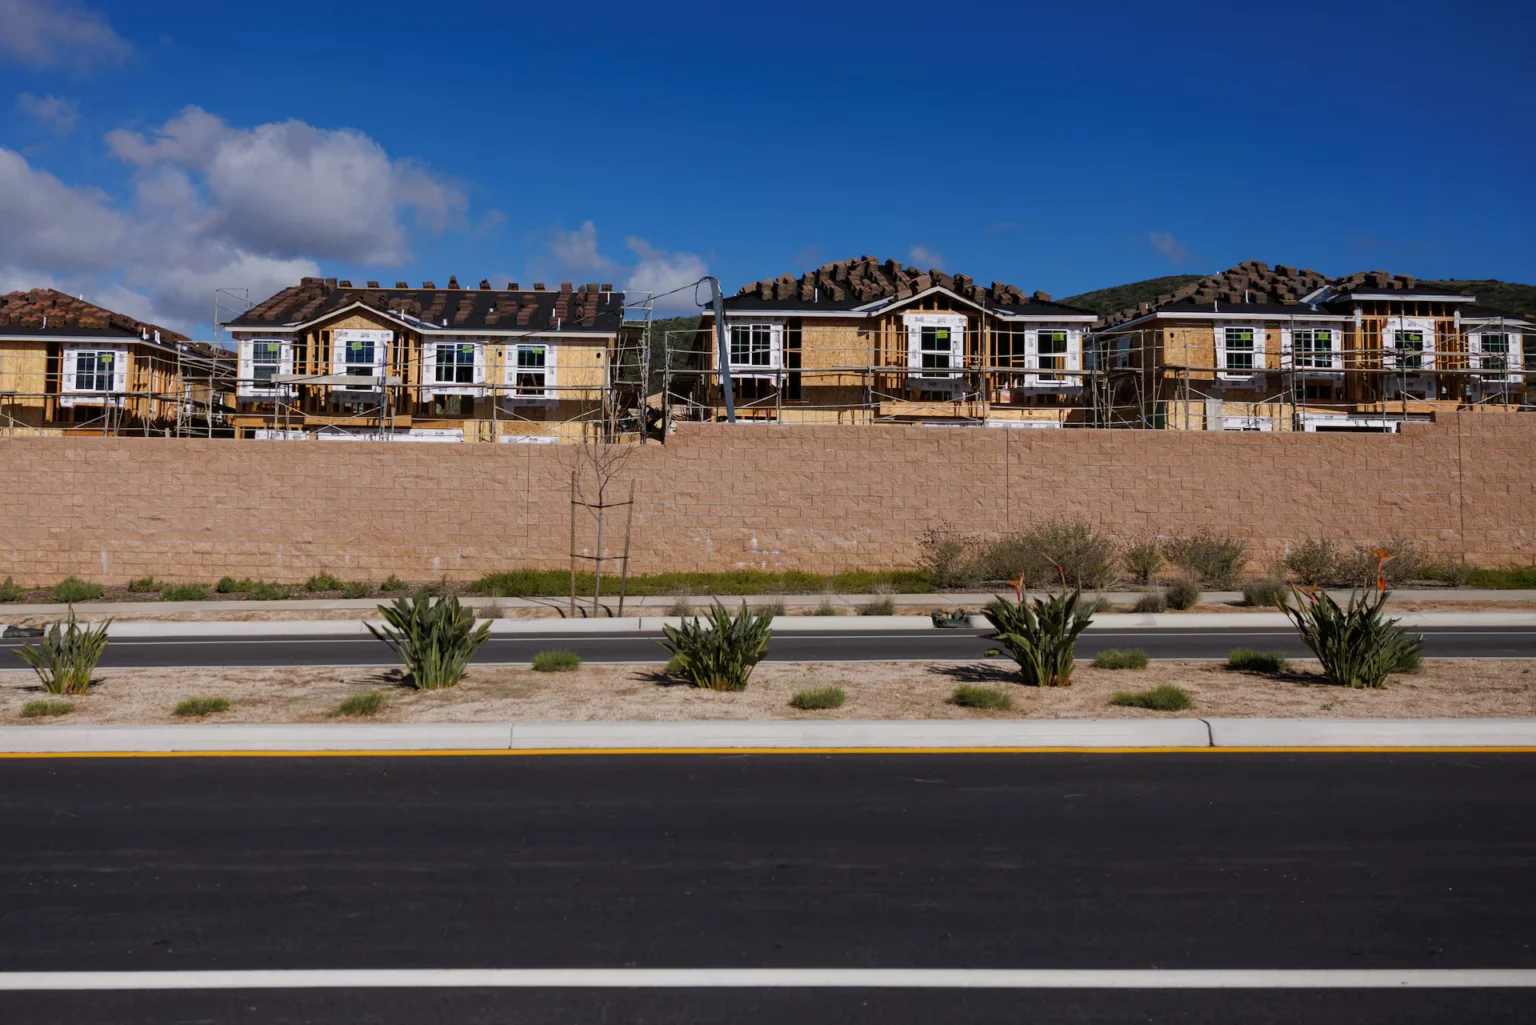
The completion side remains the mitigating factor. Single-family completions in April held at 903,000 units, off only 1.0% from March’s 912,000 – meaning units already under construction are finishing at a stable pace. The existing pipeline is still delivering. Buyers waiting for resale inventory may see some relief as completions flow into listings. But once that pipeline thins – which the permits data says is already happening – completions will slow accordingly. The base case remains a grinding affordability problem, not a structural construction collapse. Still, the May 21 data release does not give builders, mortgage originators, or housing-adjacent equities much to celebrate.
Your Daily Analysis forecasts the next pressure point as the June FOMC decision. If the Fed holds or signals further restraint in response to Iran-driven inflation, another leg down in single-family starts is the path of least resistance. Watch also guidance revisions from major homebuilders – D.R. Horton, Lennar, and PulteGroup are the best leading indicators of actual builder confidence beyond the government data. Their forward order books are the true pulse of the market.